Memory Layout of a Process
Hello fellow pwners!
Let us continue our journey in Reverse Engineering and Binary Exploitation. So far, we have seen how an executable is generated, it’s internal structure and x86 assembly. In this post, let us see how a program looks like when it is being executed.
This is the 4th post in this series. So, create a directory post_4 in the rev_eng_series directory and store all the work done in this directory.
1. What all does a program have?
Consider this program code1.c .
#include<stdio.h>
#include<stdlib.h>

int gv1;
int gv2 = 123;

void func1();

int main() {

    int lv = 222, *dyn;

    dyn = (int *)malloc(sizeof(int));

    printf("Address of lv, a local variable = %p\n", &lv);
    printf("Value of dyn(dynamically allocated memory) = %p\n", dyn);
    printf("Address of gv1, an uninitialized global variable = %p\n", &gv1);
    printf("Address of gv2, an initialized global variable = %p\n", &gv2);
    printf("Address of func1 = %p\n", func1);
    printf("Address of main = %p\n", main);

    printf("\nPID = %d\n", getpid());

    func1();

    while(1);

    return 0;
}

void func1() {

    int lv2 = 999;
    printf("Address of lv2, a local variable of func1 = %p\n", &lv2);
    return;
}
a. In general, a program can have these elements:
- Global Variables - gv1 and gv2
- Functions - main and func1
- Every function will have it’s own set of private / local variables - lv1 for main and lv2 in func1
- Might have dynamically allocated variables - dyn
- Functions from external / Shared Libraries - printf(), getpid()
b. Every element in the above list is stored in a particular location based on what they are. Eg: Machine code is stored in a particular memory location. Global Variables are stored in a different memory location. In this article, we will see how a program’s memory is divided into different locations where all these elements are stored.
2. Program Vs Process
Sometimes, we use the words Program and Process interchangbly but they definitely not the same. It is important to understand the difference.
-
A Program is typically an executable stored in the Hard-Disk. It is an ELF File with segments, sections, headers etc.,
-
When you run a program, you spawn a process. You can think of a process as a Program under Execution . A process lives in the main memory, but a program just exists dead in Hard Disk.
-
A process lives because it is being executed, every instruction in it is being executed, every variable is allocated some memory, values are changing, functions are being called etc., There is so much happening when a program is executed, but a program by itself is just a file sitting in the Hard-Disk waiting to be executed.
3. How does a process look like in memory?
We said that a process is program under execution. We have seem how a program looks like. It has ELF Header, Program Header Table, Section Header table, Segments, sections etc.,
The Program Headers will decide the Memory Layout of a process.
Now, let us look at the process. This is rough Memory Layout of any process. This is how a process lives in Main Memory.
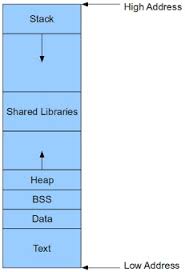
Let us start discussing from bottom to top of that image.
a. Text Section : This section has pure machine code in it. It contains all the functions we would have written in the program in binary form. Note that starts from the Lowest Address .
b. Data section : This section is where Global Initialized Variables are stored. It is right above the Text section.
c. BSS section : BSS section contains all Global Uninitialized Variables. As far as I know, BSS is know as Better Save Space because in the object file, it does not take any space except the name and size of the variable. It is given actual memory only when the program is executed - BSS variables come alive :P
d. Heap : First thing I want to clarify is that this Heap has no relation with the Heap Data Structure . This Heap refers to a Heap of Memory like Heap of Clothes . Just a huge pile of memory which we can allocate for our variables and use at runtime.
- If memory is allocated dynamically at runtime, then that memory belongs to Heap . malloc() , calloc() functions in C and new function in C++ allocate memory from heap.
Eg: In code1.c program, dyn is a pointer to an integer. malloc() takes in an arguments of size of memory we want and returns a pointer to that memory. This memory is taken from Heap. You will understand this clearly when we go through the example.
-
Observe the arrow mark from Heap pointing upwards. Let us take an example to understand what this pointing upwards means. Consider this program code2.c .
~/rev_eng_series/post_4$ cat code2.c #include<stdio.h> #include<stdlib.h> int main() { int *ptr, i = 0; while(i < 1000) { ptr = (int *)malloc(sizeof(int)); printf("%p\n", ptr); i++; } return 0; } -
It is a pretty straight forward program. It allocates memory using malloc and stores that Address return by malloc in ptr. The value of ptr is printed. So, we are printing the address of that memory chunk allocated by malloc. The same process is being repeated for 1000 times.
-
Point of this program is, more and more memory is allocated by malloc. Look at the following output.
---------- ---------- 0x1a05f00 0x1a05f20 0x1a05f40 0x1a05f60 0x1a05f80 0x1a05fa0 0x1a05fc0 0x1a05fe0 0x1a06000 0x1a06020 0x1a06040 0x1a06060 0x1a06080 0x1a060a0 0x1a060c0 0x1a060e0 0x1a06100 --------- --------- -
Observe the addresses. The Address Value is increasing for every new malloc you do. So, when you allocate more and more memory, memory of higher addresses get allocated. Refer to that diagram of ours. The Top of the Diagram denoted High addresses and this arrow was pointing upwards. In other words, Heap grows upwards.
-
As an experiment, in code2.c , remove that condition i < 1000 and replace it with an infinite loop and see what happens.
e. Shared Libraries : The most commonly used Shared Library by a C program is the libc . C++ programs use libc++ .
f. Stack : This part of process memory is used to store Local Variables of a function. Stack is the Back-Bone of any program because Control Flow (Function Call and Return) is maintained with the help of the stack. We will see how exactly Stack behaves as a back-bone of a program in upcoming posts.
- Note that Stack grows downwards. That is, It starts with Higher Addresses and continues to grow towards lower addresses - just opposite of Heap.
Now that theory is done, let us dive into practicals part and experiment with what all we have discussed so far.
4. Practicals
Consider code1.c . Compile it and get a program named code1 program.
a. This is the output of code1 is something like this.
~/rev_eng_series/post_4$ ./code1
Address of lv, a local variable = 0x7ffef69b45dc
Value of dyn(dynamically allocated memory) = 0x1e91010
Address of gv1, an uninitialized global variable = 0x601058
Address of gv2, an initialized global variable = 0x601050
Address of func1 = 0x4006f5
Address of main = 0x400626

PID = 5667
Address of lv2, a local variable of func1 = 0x7ffef69b45b4
b. Compare the Output of the code1.c with the diagram which we discussed earlier. Compare the Addresses of every segment. It should perfectly match what we have discussed.
- Address of lv(Local variable - Stack) > Value of dyn(Dynamically allocated - Heap) > Address of gv1(Uninitialized variable - BSS) > Address of gv2(Initialized variable - Data Section) > Address of main(Machine code - Text Section)
NOTE : The program comes to a still state because of that while(1) . This Infinite Loop is put just to keep the process alive in the main memory and we can do our analysis with ease. Open up a new terminal for further analysis.
-
In an Operating System, there can be hundreds of processes running. There should be some method to identify a process in a unique manner(like the way you have your Social Security Number or Aadhar Number in India) . The OS assigns a Process ID to every process. As our code1 is still running, we can get it’s Process ID / PID .
-
The PID = 5667 . I have put a printf() statement in code1.c which prints the PID just to make our analysis easy. Another way to get PID of a process is to use ps command.
-
Once we have the PID of any process, the best way to learn about that particular process is to go to the /proc directory. proc is short form for process. This has details of every process running in the OS. Let’s go to that directory.
/proc$ ls 1 1638 230 28 3307 3824 48 99 mdstat 10 1709 236 290 3317 385 49 acpi meminfo 100 1757 2380 2999 3318 3859 4983 asound misc 1035 18 24 30 333 3886 50 buddyinfo modules 105 180 2416 3001 3341 39 51 bus mounts 106 181 2442 3012 3365 3903 5151 cgroups mtrr 1068 182 2443 3019 3375 393 5152 cmdline net 11 183 2449 3045 3380 3960 5178 consoles pagetypeinfo 1111 184 2451 3088 3385 4 5188 cpuinfo partitions 1113 185 25 3089 3394 40 53 crypto sched_debug 1148 1859 2504 3090 34 4090 5353 devices schedstat 115 186 2566 3091 3405 41 54 diskstats scsi 1153 1860 2578 3092 3418 4155 5449 dma self 1155 1861 26 3094 3420 4158 5454 driver slabinfo 1157 1862 2601 3096 3439 4170 5456 execdomains softirqs 1159 1863 2615 3097 3485 4193 5528 fb stat 1166 187 2616 31 3507 42 5531 filesystems swaps 1168 1870 2620 3128 3514 4218 5552 fs sys 1173 19 2621 3191 3518 4221 5556 i8k sysrq-trigger 12 191 2630 3197 3525 4224 5557 interrupts sysvipc 13 192 2635 32 3638 4228 56 iomem thread-self 132 1923 2647 321 3648 4232 5627 ioports timer_list 1364 193 2653 3213 3650 4242 5644 irq tty 1399 194 2663 3217 3681 43 5667 kallsyms uptime 14 199 2675 3239 3694 4334 5694 kcore version 1405 2 2680 325 3706 4391 5695 keys version_signature 1430 20 2682 326 373 44 57 key-users vmallocinfo 15 201 2691 3280 38 45 5727 kmsg vmstat 1565 21 2696 3294 3811 46 6 kpagecgroup zoneinfo 1566 22 27 3296 3816 4618 7 kpagecount 16 227 270 3299 3817 4620 8 kpageflags 1614 2276 2706 33 3820 4677 855 loadavg 1627 229 2721 3302 3821 4783 9 locks /proc$ -
See, it has directories named after processes’ PIDs. I want to explore about PID = 5667 . So, I will navigate into that directory.
/proc/5667$ ls attr exe mounts projid_map status autogroup fd mountstats root syscall auxv fdinfo net sched task cgroup gid_map ns schedstat timers clear_refs io numa_maps sessionid timerslack_ns cmdline limits oom_adj setgroups uid_map comm loginuid oom_score smaps wchan coredump_filter map_files oom_score_adj smaps_rollup cpuset maps pagemap stack cwd mem patch_state stat environ mountinfo personality statm /proc/5667$ -
It has a lot of information about the process. As we are discussing about the memory layout of the process, we will look into a memory-related of files present here.
-
First, let us look into the map_files directory.
/proc/5667/map_files$ ls -l total 0 lr-------- 1 adwi adwi 64 Aug 18 17:30 400000-401000 -> /home/adwi/rev_eng_series/post_4/code1 lr-------- 1 adwi adwi 64 Aug 18 17:30 600000-601000 -> /home/adwi/rev_eng_series/post_4/code1 lr-------- 1 adwi adwi 64 Aug 18 17:30 601000-602000 -> /home/adwi/rev_eng_series/post_4/code1 lr-------- 1 adwi adwi 64 Aug 18 17:30 7f4e217a0000-7f4e21960000 -> /lib/x86_64-linux-gnu/libc-2.23.so lr-------- 1 adwi adwi 64 Aug 18 17:30 7f4e21960000-7f4e21b60000 -> /lib/x86_64-linux-gnu/libc-2.23.so lr-------- 1 adwi adwi 64 Aug 18 17:30 7f4e21b60000-7f4e21b64000 -> /lib/x86_64-linux-gnu/libc-2.23.so lr-------- 1 adwi adwi 64 Aug 18 17:30 7f4e21b64000-7f4e21b66000 -> /lib/x86_64-linux-gnu/libc-2.23.so lr-------- 1 adwi adwi 64 Aug 18 17:30 7f4e21b6a000-7f4e21b90000 -> /lib/x86_64-linux-gnu/ld-2.23.so lr-------- 1 adwi adwi 64 Aug 18 17:30 7f4e21d8f000-7f4e21d90000 -> /lib/x86_64-linux-gnu/ld-2.23.so lr-------- 1 adwi adwi 64 Aug 18 17:30 7f4e21d90000-7f4e21d91000 -> /lib/x86_64-linux-gnu/ld-2.23.so /proc/5667/map_files$-
This directory has a list of all the files(in the Hard-Disk) which are mapped into the main memory. Mapping simply means that copying the file on a Hard-Disk to Main Memory. This mapping is done by a function called mmap . To learn more about mmap, refer to it’s manual page.
-
You can see that there are 10 entries here. The first 3 Entries are mappings of code1 / executable.
-
The next 4 entries are mapping of something called libc-2.23.so . libc is the name given to the Standard C Library . 2.23 is the version number. so stands for Shared Object. This Shared Object is an Object file with all the C Library Functions in a compiled form. It has all our printf(), scanf(), fopen(), fclose() etc., in machine code form. As our program is using C library functions, it is mapped to the process’s memory. To know more about libc, refer it’s manpage.
-
The next 3 entries are mapping of ld-2.23.so .This is the ELF Dynamic Linker. This program will find, load / copy the shared libraries used by the executable onto it’s memory. As our program is using C library functions, it is ld-2.23.so’s responsibility to copy libc-2.23.so onto main memory.
-
Here, those 0x400000 - 0x401000 , 7f4e21d90000-7f4e21d91000 etc., are all address spaces. These address spaces are range of Addresses used to store something related to the process.
-
One question should arise here. Why is the code1 mapped 3 times in 3 different address spaces? or libc-2.23.so mapped into 4 address spaces? Let us dig more to understand this.
-
-
Let us see the maps file.
00400000-00401000 r-xp 00000000 08:02 3805083 /home/adwi/rev_eng_series/post_4/code1 00600000-00601000 r--p 00000000 08:02 3805083 /home/adwi/rev_eng_series/post_4/code1 00601000-00602000 rw-p 00001000 08:02 3805083 /home/adwi/rev_eng_series/post_4/code1 01e91000-01eb2000 rw-p 00000000 00:00 0 [heap] 7f4e217a0000-7f4e21960000 r-xp 00000000 08:02 25694643 /lib/x86_64-linux-gnu/libc-2.23.so 7f4e21960000-7f4e21b60000 ---p 001c0000 08:02 25694643 /lib/x86_64-linux-gnu/libc-2.23.so 7f4e21b60000-7f4e21b64000 r--p 001c0000 08:02 25694643 /lib/x86_64-linux-gnu/libc-2.23.so 7f4e21b64000-7f4e21b66000 rw-p 001c4000 08:02 25694643 /lib/x86_64-linux-gnu/libc-2.23.so 7f4e21b66000-7f4e21b6a000 rw-p 00000000 00:00 0 7f4e21b6a000-7f4e21b90000 r-xp 00000000 08:02 25694615 /lib/x86_64-linux-gnu/ld-2.23.so 7f4e21d71000-7f4e21d74000 rw-p 00000000 00:00 0 7f4e21d8f000-7f4e21d90000 r--p 00025000 08:02 25694615 /lib/x86_64-linux-gnu/ld-2.23.so 7f4e21d90000-7f4e21d91000 rw-p 00026000 08:02 25694615 /lib/x86_64-linux-gnu/ld-2.23.so 7f4e21d91000-7f4e21d92000 rw-p 00000000 00:00 0 7ffef6996000-7ffef69b7000 rw-p 00000000 00:00 0 [stack] 7ffef69bd000-7ffef69c0000 r--p 00000000 00:00 0 [vvar] 7ffef69c0000-7ffef69c2000 r-xp 00000000 00:00 0 [vdso] ffffffffff600000-ffffffffff601000 r-xp 00000000 00:00 0 [vsyscall] -
Entry 1:
- Address space : 0x400000 - 0x401000
- The Text Section of a program is mapped onto this address space.The Text Segment contains Header details and the C program we wrote in form of machine language.
- Second column is r-xp . r stands for Read Permission, w stands for Write Permission and x stands for Executable Permission. This Address space has Read and Executable Permissions. It means, it can be read and it can be executed also. Generally, any segment which has Executable Permissions will also have Read Permissions because you have to read and process the segment to execute code in it.
-
Entry 2:
- Address space : 0x600000 - 0x601000
- The read-only section is mapped onto this address space. This Section consists of Hard-coded strings etc., It’s permissions is r–p as expected.
-
Entry 3:
- Address space : 0x601000 - 0x602000
- This is the Data Section. It has all the global variables in it. Check out the addresses of gv1 and gv2 of code1 .
- It’s permissions is rw-p .
-
The point to understand is, all these 3 sections belong to the same file - /rev_eng_series/post_4/code1 . So, the same file is not being mapped thrice, but 3 different sections(Text, Read-Only, Data) of the same executable file are mapped to 3 different address spaces.
-
Entry 4:
- Address space : 01e91000-01eb2000
- This is the heap . This whole Address space is given to this process and the process can use it whenever it wants. Check out the value of dyn . Whenever the process wants memory at runtime(Dynamic allocation), a piece of memory of requested size is given to the process.
- It’s permissions is rw-p .
-
Entry 5, 6, 7 & 8:
- There are 4 Address spaces.
- Notice that each Address space has a different set of permissions. This means the Shared Library libc-2.23.so has segments of those permissions. Each of those segments is mapped in a different Address space.
-
Entry 10, 12 & 13:
- There are 3 Address spaces.
- ld-2.23.so has 3 parts with different permissions. So, each part is mapped into a different address space.
-
Entry 14:
- Address space: 7f4e21d91000-7f4e21d92000
- This is the stack Address space. This is the place where all the local variables, arguments to functions, control information are stored.
- It’s permissions are rw-p .
-
Entry 15, 16 and 17 require a bit of Operating System Internals which we have not discussed as of now. We will probably discuss in later posts, but will discuss it for sure!
-
We just had a look at how a process looks like in memory. There are different address spaces, each address space serving a particular purpose.
With this, I hope you have understood how a program looks like in memory when it is being executed.
5. A few more important things!
a. Why does the heap grow upward and stack downward?
-
There is no rule that heap should grow upward and stack downward. The growth of heap and stack depends on the processor . We are using x86 where stack is designed to grow down.
-
There are architectures like SPARC , ARM(Famous mobile-phone architecture) where the growth direction can be chosen. So, stack can either grow down or up.
-
This stackoverflow answer should give you more insight: Link
b. Do we always need to map shared libraries?
-
Library functions like printf(), scanf() etc., are present in libc-2.23.so . When they are called, the Dynamic Linker - ld-2.23.so gives an address to the Library function called(Dynamically Links it) and after the function is given an address, it works like any other normal function.
-
The C / C++ programs we compile are Dynamically Linked by default. That is, the functions they use (say printf) are given addresses when it is called and then it is executed.
-
If shared libraries are not mapped onto the process’s memory, we cannot use the library functions if the programs are dynamically linked .
-
We can also do this. Suppose an executable is using printf. I can copy the complete sourcecode of printf into my executable. Now, even if I don’t map libc, I will be able to run printf because it is present in my executable itself.
-
In general, suppose a program uses 10 C library functions. Copy sourcecode of all those 10 library functions from libc into the executable while compiling. So, I can run the executable independent of libc.
-
This concept of copying sourcecode of functions being used by a program into it’s executable is known as Static Linking .
-
The sourcecode mentioned above refers to machine code of those functions.
-
Let us take an example to understand this better. Consider a simple hello.c .
#include<stdio.h> int main() { printf("Hello world!\n"); return 0; }- This program uses 1 C Library function - printf() .
-
Let us compile it in the following manners.
~/rev_eng_series/post_4$ gcc hello.c -o hello_dynamic ~/rev_eng_series/post_4$ gcc hello.c -o hello_static --static -
The first line, you get hello_dynamic which is a dynamically linked executable - It does not have the sourcecode of printf() in it. It just has information which will help in dynamic linking.
-
The second will result in hello_static . This will have the whole sourcecode of printf() .
-
Check this out:
~/rev_eng_series/post_4$ ls -l hello_dynamic hello_static -rwxrwxr-x 1 adwi adwi 8600 Aug 18 22:22 hello_dynamic -rwxrwxr-x 1 adwi adwi 912664 Aug 18 22:22 hello_static ~/rev_eng_series/post_4$
-
Just observe the size difference. I hope you are able to catch the point.
-
Let us use the file command and analyze these.
~/rev_eng_series/post_4$ file hello_dynamic hello_dynamic: ELF 64-bit LSB executable, x86-64, version 1 (SYSV), dynamically linked, interpreter /lib64/ld-linux-x86-64.so.2, for GNU/Linux 2.6.32, BuildID[sha1]=0d3706238a91f3ab4323e48c5a2971f5950aa7a3, not stripped ~/rev_eng_series/post_4$ file hello_static hello_static: ELF 64-bit LSB executable, x86-64, version 1 (GNU/Linux), statically linked, for GNU/Linux 2.6.32, BuildID[sha1]=d8e808a57289057b01ffd14f67cb8cc887b0e615, not stripped ~/rev_eng_series/post_4$ -
The point of focus is that hello_dynamic is dynamically linked and it has interpreter = /lib64/ld-linux-x86-64.so.2 .
- On the other hand, hello_static is statically linked and does not have the dynamic linker specified because it does not need one.
-
Statically Linked executables are Independent executables . They have no dependencies. They can run on a machine which does not have libc in it.
-
This article should give you more insight on when to use dynamic linking and when to use static linking.
c. Why are there different permissions for different address spaces? Can’t all have a simple rwxp rather than each one having a different one?
-
There is a long history behind this. And when it comes to permissions or allowing/disallowing someone to do something security comes into picture.
-
In late 1990s, there was a lot software being written and used. Then, permissions were not this strict. All address spaces were rwx . That is, every address space could be read, executed and written into.
-
Bad Guys started finding bugs / security holes in programs. There were holes which allowed them to execute whatever they wanted. They could inject / write code into the stack and execute it. If they are able to execute anything, they could bring the huge servers down, all user machines to crash or install Malicious Software like viruses, worms, trojans onto machines.
-
That’s when it struck that we need to have a strong control on what address space is being used for. Not all address spaces should be executable and writable.
-
So, Stack and Heap - Wherever data is stored, these were made rw-p . So, even if a bad guy is able to write code into stack / heap, he/she cannot execute it simply your OS doesn’t let you to.
-
In a similar manner, all executable address spaces were made r-xp . The Write permission was removed to make sure no bad guy should be able to change the sourcecode of a running program.
-
Notice that, If you able to write into an address space, you are not able to execute it or if you are executing instructions in that address space, you cannot write into it. It is either Write or Execute but never both for an address space. This Security Technique came to be known as W^X / Write XOR Execute .
-
It became a very successful security technique that it was implemented at the hardware level in all major processors like Intel, AMD .It is one bit of information. Intel guys called it WriteDisabled / WD bit. If this bit is set to 1, then you cannot write into it. AMD guys called it NoExecute / NX bit. If this bit is set to 0, you cannot write into it, you can execute it. Microsoft called it Data Execution Prevention .
-
In later posts, we will talk about what exactly those security holes are, how a bad guy can execute whatever he wants, how we can mitigate them, how to break W^X Security Technique and more.
d. To know more about /proc , best place is to visit it’s man page.
With this, I will end this post. I hope you learned something out of this post.
Thank you!
Go to next post: Program Execution Internals - Part1
Go to previous post: Introduction to x86 Assembly Programming